
How to Calculate Cost Savings: Proven Strategies & Tips
When you boil it down, calculating cost savings is all about measuring the real financial gain from a decision you've made. The basic math is pretty simple: Baseline Cost - New Cost = Cost Savings. This formula is your starting point for seeing the direct dollar-and-cents impact of any new purchasing strategy.
Laying the Groundwork for Accurate Calculations

Before you can confidently say, "Here's exactly how much we saved," you need to get crystal clear on what you're actually measuring. It's about so much more than just looking at two different price tags. To get a true picture of your financial gains, you have to understand the two very different kinds of savings that boost your bottom line.
Distinguishing Between Hard and Soft Savings
First up, you have hard savings. These are the most obvious wins—direct, measurable drops in what you're spending. When you land a lower price per unit through a group purchasing deal, that's a hard saving. The money you didn't spend is right there, clear as day on your budget.
Then there are soft savings. These are a bit more slippery and harder to pin down with a specific number, but they're incredibly valuable. Think about the time your team saves by not having to source and negotiate with ten different vendors. That’s a soft saving. It won't show up on an invoice, but the value it adds through improved efficiency is undeniable.
A holistic view is essential for success. Real financial clarity comes from recognizing how both hard and soft savings impact your bottom line, especially when using strategies like group purchasing.
This distinction is so important because if you only focus on hard savings, you're missing a huge part of the story and seriously underestimating the total value you're creating.
Hard Savings vs Soft Savings
Here's a quick way to think about the difference between these two types of savings and how to spot them in your own group purchasing efforts.
| Attribute | Hard Savings | Soft Savings |
|---|---|---|
| Nature | Direct, tangible reduction in cash outflow. | Indirect benefits that improve efficiency or avoid future costs. |
| Measurement | Easily quantifiable with clear financial data. | Often qualitative and more difficult to assign a dollar value. |
| Example | Lower price per unit on a bulk order of office supplies. | Reduced administrative time spent managing vendor contracts. |
| Budget Impact | Immediately visible on financial statements. | Frees up resources and time for other value-added tasks. |
Ultimately, a good cost-saving strategy has a healthy mix of both. While hard savings pay the bills today, soft savings build a more efficient and resilient business for tomorrow.
It's a tough balance to strike. A Boston Consulting Group survey revealed that only 48% of cost-saving targets were actually met, which just goes to show how many businesses struggle to manage costs effectively. As you dig into calculating your own savings, looking at some easy ways to reduce operational costs can give you some practical ideas to get started.
Establishing Your True Baseline Cost
Before you can even begin to talk about savings, you have to know exactly what you were paying in the first place. This is your baseline cost, and without an accurate one, any calculation you do is just a shot in the dark. Think of it as the "before" photo in your financial transformation—it’s the benchmark everything else gets measured against.
The best way to nail this down is to get your hands on some hard data. Pull up your old invoices, purchase orders, and accounting records to see the actual price you paid for a specific product or service. I'm not talking about the list price; I mean the final number that actually left your account.
Uncovering Hidden Costs
Here's where a lot of people go wrong: they forget about all the extra expenses that get tacked onto the initial price. These hidden costs can really add up, and they're often the difference between a rough guess and your true baseline.
Make sure you’re including everything:
- Shipping and Freight Charges: Especially for physical goods, these can easily add a significant chunk to your total.
- Taxes and Duties: Don’t forget about sales tax, import fees, or any other government-mandated charges. They are absolutely part of the real cost.
- Implementation or Onboarding Fees: Many software tools and specialized services come with one-time setup costs. These need to be factored in.
When you add all these up, you get what’s known as the Total Cost of Ownership (TCO). This is the most complete and accurate baseline you can possibly have. Once you've identified these expenses, the next step is assigning them correctly, which you can read more about in our guide to effective cost allocation methods.
Getting your baseline right is non-negotiable. I've seen people overlook small fees, and it completely throws off their results, making savings look much bigger—or smaller—than they really are. Precision at this stage is what makes your final numbers trustworthy.
This infographic breaks down the process of finding your true baseline cost into three essential stages.
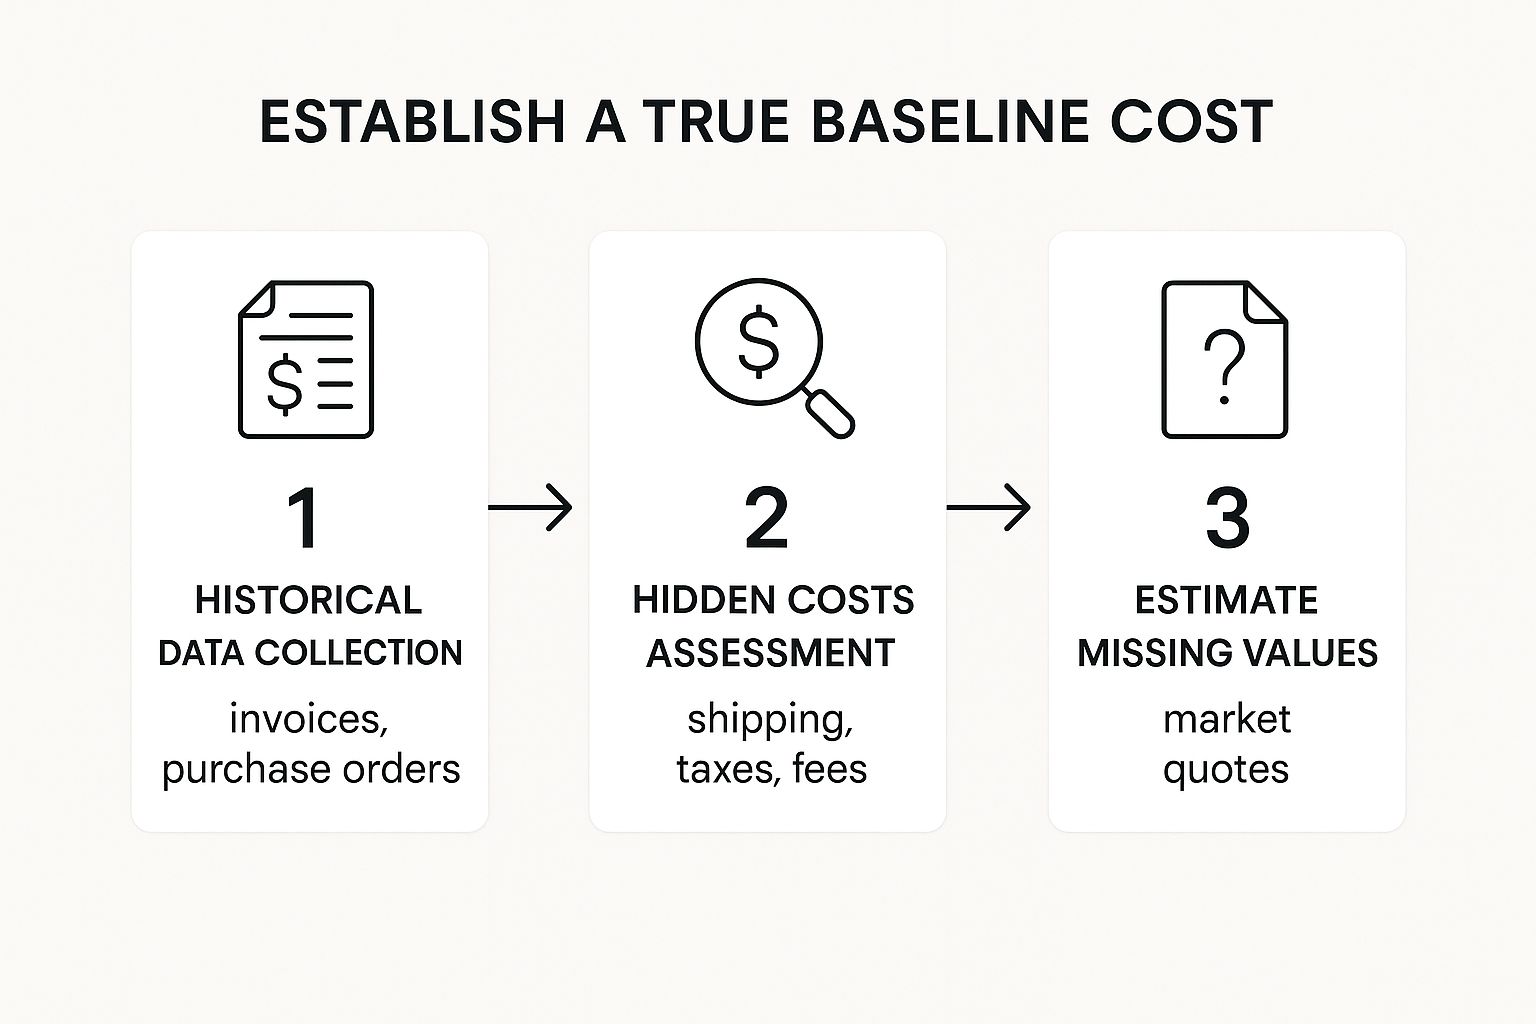
As you can see, it all starts with collecting historical data, then moves to identifying all those hidden costs, and finally, using market research to fill in any gaps.
What If You Have No Data?
But what happens if this is a brand-new purchase for your team? If you don't have any past data to pull from, you'll need to create a solid estimate.
The best approach is to reach out to several suppliers and get quotes as if you were buying the item or service on your own. Take the average of those quotes, and you've got a defensible baseline. It’s a bit of extra work up front, but it’s the only way you’ll be able to prove the real value of your group purchasing efforts later on.
Calculating Hard Savings from Group Purchasing

This is where the rubber meets the road. After establishing your spending baseline, you can start tracking the direct financial wins—what we call hard savings. When it comes to strategies like group purchasing, these numbers give you undeniable proof that your efforts are paying off.
The underlying math is actually pretty simple. It all boils down to one powerful formula that shows you exactly what you've saved on any given purchase.
(Baseline Cost - New Cost) x Quantity = Hard Savings
This formula cuts right to the chase. It shows you the total cash saved by comparing your old price to your new one, multiplied by how many units you bought. It’s a clean, direct way to measure the impact on your bottom line. Often, the easiest wins come from comparing different solutions, which is how many businesses save money with BI tools and other software.
Putting the Formula into Practice
Let's walk through a scenario I see all the time. Imagine three local cafes decide to pool their resources to buy coffee beans together. This kind of collaboration is a classic example of group purchasing and highlights how it drives down costs for everyone. If you're new to the concept, you can learn more in our guide on what is group purchasing.
Here’s what their individual costs looked like before they teamed up:
- Cafe A: Bought 50 lbs of beans per month at $12/lb
- Cafe B: Bought 75 lbs of beans per month at $11.50/lb
- Cafe C: Bought 60 lbs of beans per month at $12.25/lb
As you can see, they were all paying different rates. By combining their order to 185 lbs, they suddenly had the leverage to negotiate a much better deal: a single price of $9.50 per pound for all three of them.
Now, let's plug those numbers into our formula to see what each cafe saved:
- Cafe A Savings: ($12.00 - $9.50) x 50 lbs = $125 per month
- Cafe B Savings: ($11.50 - $9.50) x 75 lbs = $150 per month
- Cafe C Savings: ($12.25 - $9.50) x 60 lbs = $165 per month
Together, the group is saving a whopping $440 every single month. This is the power of collective bargaining in action—a tangible result that immediately boosts each owner's profitability. This kind of smart financial planning isn't just a local trend; recent data shows a significant rise in savings rates across many economies, underscoring a global shift toward more strategic spending. You can dig into some of these global financial trends from the World Bank to see the bigger picture.
How to Quantify Indirect and Soft Savings

The best purchasing decisions often deliver value that you won't find on an invoice. These benefits, often called soft savings, are all about boosting efficiency and cutting down on risk. They might not show up on a financial statement, but figuring out how to calculate these cost savings is key to seeing the whole picture.
Putting a number on these gains takes a little creativity, but it's completely doable. The trick is to tie these less tangible benefits back to a concrete financial metric—usually, your team's time.
Think of it this way: every hour your team isn't spending on tedious administrative tasks is an hour they can dedicate to activities that actually grow the business. That's a real, measurable benefit.
Turning Time into Dollars
The most straightforward way to measure soft savings is to calculate the value of time saved. First, you need to know the fully-burdened hourly cost for an employee who handles procurement. This isn't just their salary; you have to factor in benefits, payroll taxes, and general overhead.
Here's a simple formula to get you started:
(Employee's Annual Salary + Benefits) / Total Annual Work Hours = Fully Burdened Hourly Rate
Once you have that hourly rate, you can start applying it to any process you've made more efficient.
Let's walk through an example. Imagine your team used to spend 15 hours every month just sourcing quotes, haggling with different vendors, and managing a pile of contracts. After joining a group purchasing organization, you’ve streamlined all that work into a single relationship, slashing the time required to just 3 hours a month.
Here’s how you'd calculate the savings:
- Time Saved: 15 hours - 3 hours = 12 hours per month
- Employee's Hourly Rate: Let's use a realistic rate of $45/hour.
- Monthly Soft Savings: 12 hours x $45 = $540
- Annual Soft Savings: $540 x 12 = $6,480
Suddenly, a simple efficiency gain becomes a compelling financial figure. This is a powerful way to show value that decision-makers might have otherwise missed. When you combine these indirect savings with your hard savings, you get a much more complete and impressive view of your strategy's success.
How to Present Your Savings for Maximum Impact
Getting the numbers right is only half the battle. Once you've calculated the cost savings, you need to present them in a way that truly lands with leadership and proves your strategy is working. It’s about turning raw data into a compelling story of success.
The key is to combine the tangible, hard savings with the equally important (but often overlooked) soft savings. I've found that framing the final figure as “Total Value Delivered” works wonders. This single metric captures everything—the direct financial wins and the crucial gains in efficiency—giving you a much more powerful narrative.
Creating a Clear and Compelling Savings Report
Don't just throw a spreadsheet at them. You need to make your results easy to grasp in a single glance. Simple visuals, like a bar chart showing the "Before" and "After" costs, can communicate your impact far better than a dense table of numbers. The clearer you make it, the more your success will shine through.
When you summarize your findings, be sure to spotlight the big-ticket items:
- Total Savings: The complete dollar amount, combining both hard and soft savings.
- Percentage Savings: This is great for showing the scale of the improvement relative to your starting costs.
- Projected Annual Savings: This is your forward-looking number, showing how the savings will continue to deliver value over time.
It's not just about showing what you saved; it's about building a powerful story of financial stewardship. Your report is tangible proof that your procurement strategy is a core contributor to the company's health.
Smart cost management is a universal goal, especially at a time when personal savings rates in the U.S. have been squeezed by rising costs. You can read more about how Americans are saving and spending to get a broader perspective.
To put all of this into practice, our cost-benefit analysis template provides a fantastic framework for organizing and presenting your findings effectively.
Of course. Here is the rewritten section, designed to sound human-written, natural, and expert-led.
Navigating the Nuances of Cost Savings Calculations
Even with the right formulas in hand, things can get tricky when you move from theory to practice. The real world is messy, and a few common questions always seem to surface once you start crunching the numbers.
What If My Baseline Costs Aren't Stable?
This one comes up all the time. "How do I handle fluctuating baseline costs?" It's a great question, because prices for just about anything can shift with the seasons or market demand.
The best way I've found to deal with this is to use a time-weighted average. Instead of just grabbing last month's invoice, look back over the last six or even twelve months. Calculate the average price you paid during that period. This gives you a much more stable and defensible starting point for your savings calculations.
Do I Factor in One-Time Fees?
Another frequent question is about those pesky one-time implementation or setup fees. The answer is an emphatic yes, you absolutely have to include them. They are a real part of your total investment, and ignoring them paints an incomplete picture.
Here’s a practical way to do it: amortize the fee over the contract period. Let's say a new software subscription saves you $200 a month but came with a $1,200 setup fee. For the first year, you should really subtract $100 from your monthly savings to account for that initial cost. This reflects the true financial impact on your budget.
Hard Savings vs. Soft Savings: Where's the Priority?
While the hard, tangible savings are always easier to prove and have a direct impact on your bottom line, overlooking soft savings is a classic mistake.
My advice? Lead with the hard savings in any report or presentation. They’re the undeniable proof in the pudding. Then, bring in the soft savings to tell the complete story of the value you've created.
A truly compelling business case presents both. Hard savings grab attention with immediate financial gains, while soft savings demonstrate the deeper, strategic benefits like boosted productivity or lower operational risk.
At the end of the day, calculating cost savings is about building a full, honest picture of the value your decisions have generated. By thinking through these common sticking points, you can make sure your final numbers are not only accurate but also powerful.
Ready to see what you can save on the digital tools and services you use every day? Join AccountShare and tap into the power of group purchasing. Discover your potential savings at AccountShare.ai.