

Latency Optimization for Faster Shared Apps
You click play on a shared streaming account at 8:15 p.m. The spinner appears. It pauses, starts, drops quality, then catches up. Ten minutes later, the same service feels perfectly fine.
That gap is what users remember.
On shared-subscription platforms, latency isn't just a backend metric. It's the delay people feel when a family opens a video service at the same time, when a team signs into a shared design tool before a deadline, or when several users hit the same AI workspace during a busy hour. The painful part usually isn't the average experience. It's the unlucky request that gets stuck behind everyone else.
A lot of product teams still talk about speed as if one big upgrade will fix it. Faster instances. More bandwidth. Bigger caches. Those help, but they don't answer the question users ask: why did this click feel slow right now?
Why Latency Feels Instant or Infuriating on Shared Platforms
A shared platform has a particular kind of fragility. When one person uses a service alone, small delays can stay hidden. When many people arrive together, the system starts to show its seams. A login call waits on an identity service. The home screen waits on recommendations. Playback waits on entitlement checks, profile data, and a content manifest. One slow dependency can turn a normal interaction into a frustrating one.

Users don't describe this with engineering terms. They say the app felt snappy, laggy, frozen, or unreliable. That's important. Latency optimization is really about protecting trust. If a shared app responds quickly most of the time but stalls at the exact moment several people need it, users experience the product as inconsistent.
Why shared usage changes the problem
Shared platforms create two pressures at once:
- More contention: Multiple users can compete for the same backend capacity, caches, queues, and third-party APIs.
- More fan-out: A single screen often triggers several downstream requests, so one slow branch can hold up the full response.
- Sharper peaks: Demand isn't evenly spread. It clusters around work hours, evenings, launches, and deadlines.
That last point matters more than many teams expect. Plenty of systems look healthy in quiet periods. Then peak hour arrives and queueing delay appears in places that seemed fine during testing.
Practical rule: On shared platforms, users don't feel your median request. They feel your busiest moment and your slowest dependency.
What makes this guide useful
When readers get confused about latency, it's usually because the delay feels invisible. There isn't one obvious culprit. The wait could come from the user's access network, from a distant cloud region, from a congested queue, from render-blocking app logic, or from a storage burst that slowed the worst requests.
The good news is that latency can be broken down and improved systematically. Once you can see where time is being spent, fixes become more concrete. Some are architectural. Some are operational. Some are as simple as measuring the right percentile instead of celebrating a friendly average.
Understanding Latency and How It Differs From Speed
People often say "the app is slow" when they mean several different things. That's where teams start talking past each other.
If you're driving across town, latency is how long one trip takes. Bandwidth is how many lanes the highway has. A six-lane road can still be miserable if traffic barely moves. A two-lane road can feel great if cars keep flowing. Apps work the same way.
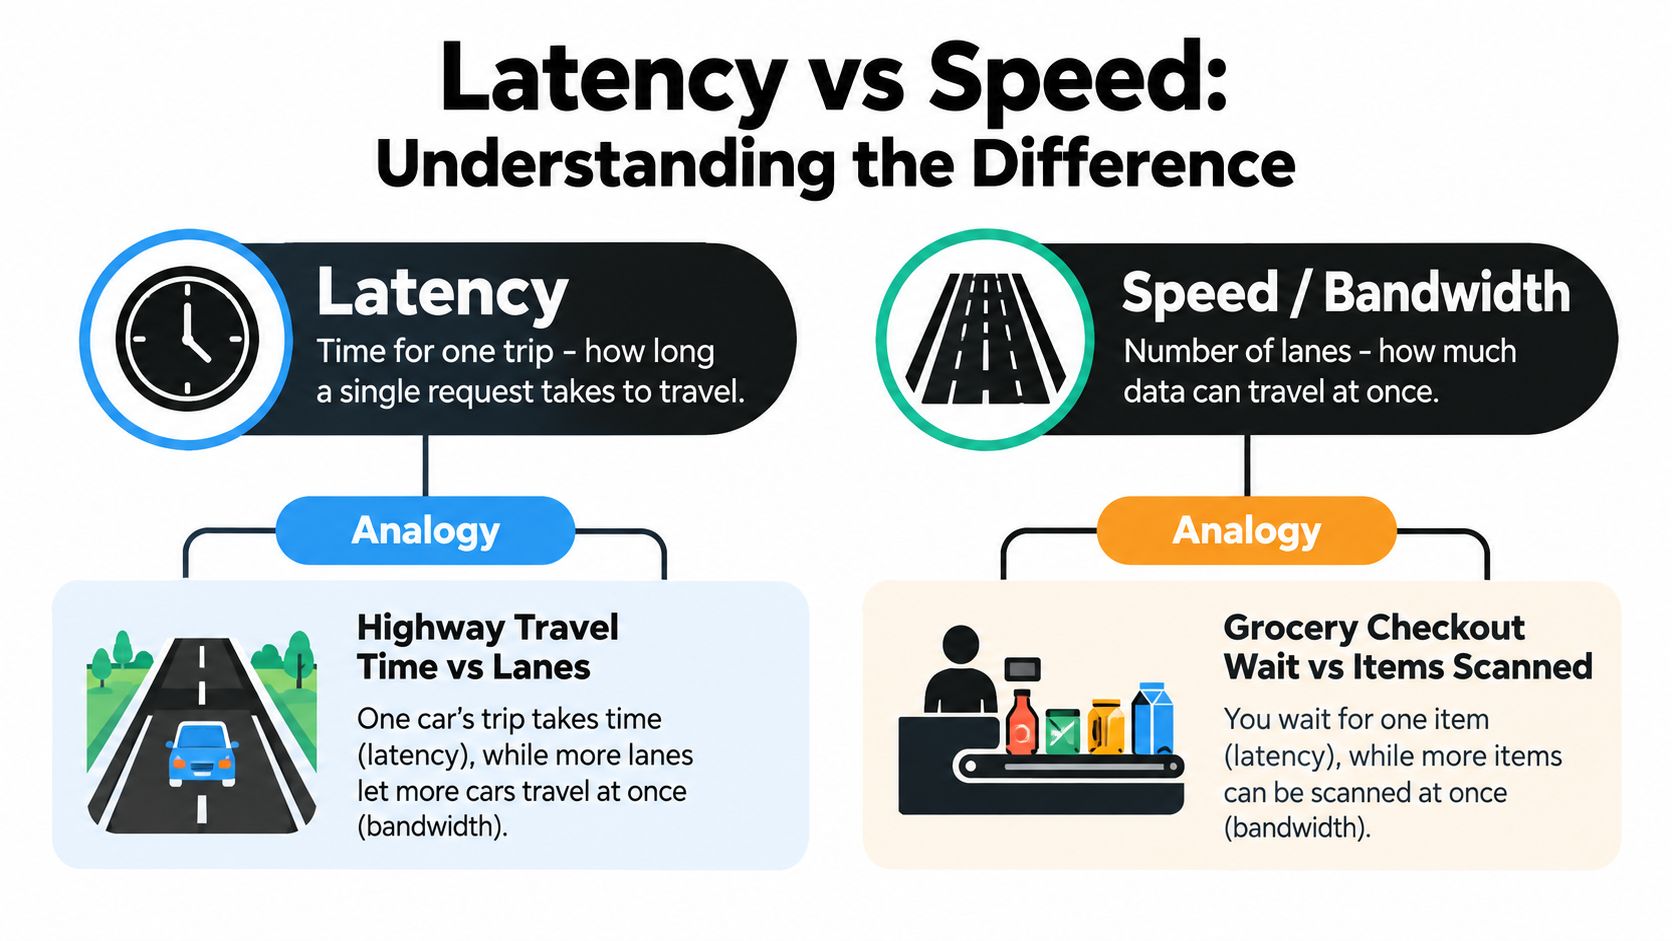
The simplest way to think about it
When someone taps a button, one request begins a trip:
- The device sends the request.
- The network carries it toward the service.
- The application processes it.
- The response comes back.
- The client renders the result.
The total wait is what the user feels. Some of that wait is travel time. Some is time spent standing in line. Some is actual work.
Latency is the time to get one answer. Speed is often about how much work can move overall. They're related, but they aren't the same thing.
A grocery line analogy that sticks
A checkout line helps separate the terms:
- Latency: How long one shopper waits before leaving with a receipt.
- Throughput: How many shoppers the store can process over time.
- Bandwidth: How much checkout capacity exists in parallel.
- Jitter: How uneven the waits are from one shopper to the next.
A store can have many registers and still create terrible latency if one shopper gets trapped behind a price check and three returns. Likewise, an app can move a lot of data overall and still feel sluggish for interactive actions.
Where user-perceived delay comes from
For product teams, it's useful to split one interaction into three parts:
- Network delay: Time spent crossing the access network and internet path.
- Processing delay: Time the server, database, cache, or model needs to do real work.
- Queueing delay: Time the request spends waiting because something is busy.
Queueing is the one that surprises teams most often. They upgrade compute and still see lag because requests aren't slow only when work is hard. They're slow when too many things need the same resource at once.
Why lower latency often matters more than bigger pipes
Interactive apps care about the first response. A chat tool, sign-in flow, search box, or playback start can feel bad even if the system transfers large files efficiently later.
That distinction also shows up in network research. A 2021 study found that edge computing improved latency by 6% to 30% versus direct cloud access, with some routing paths reaching up to 40%, but the average reduction was often only around 2 ms (networking research on edge placement and cloud-access latency). The lesson isn't that edge is weak. It's that latency optimization depends heavily on where computation happens, not just on raw server power.
Where Latency Hides Across Network App and Infrastructure
When teams investigate delay, they often stay in one comfort zone. Frontend teams inspect rendering. Platform teams inspect instances. Network teams inspect routes. Users don't care which layer caused the problem. They only feel the sum.
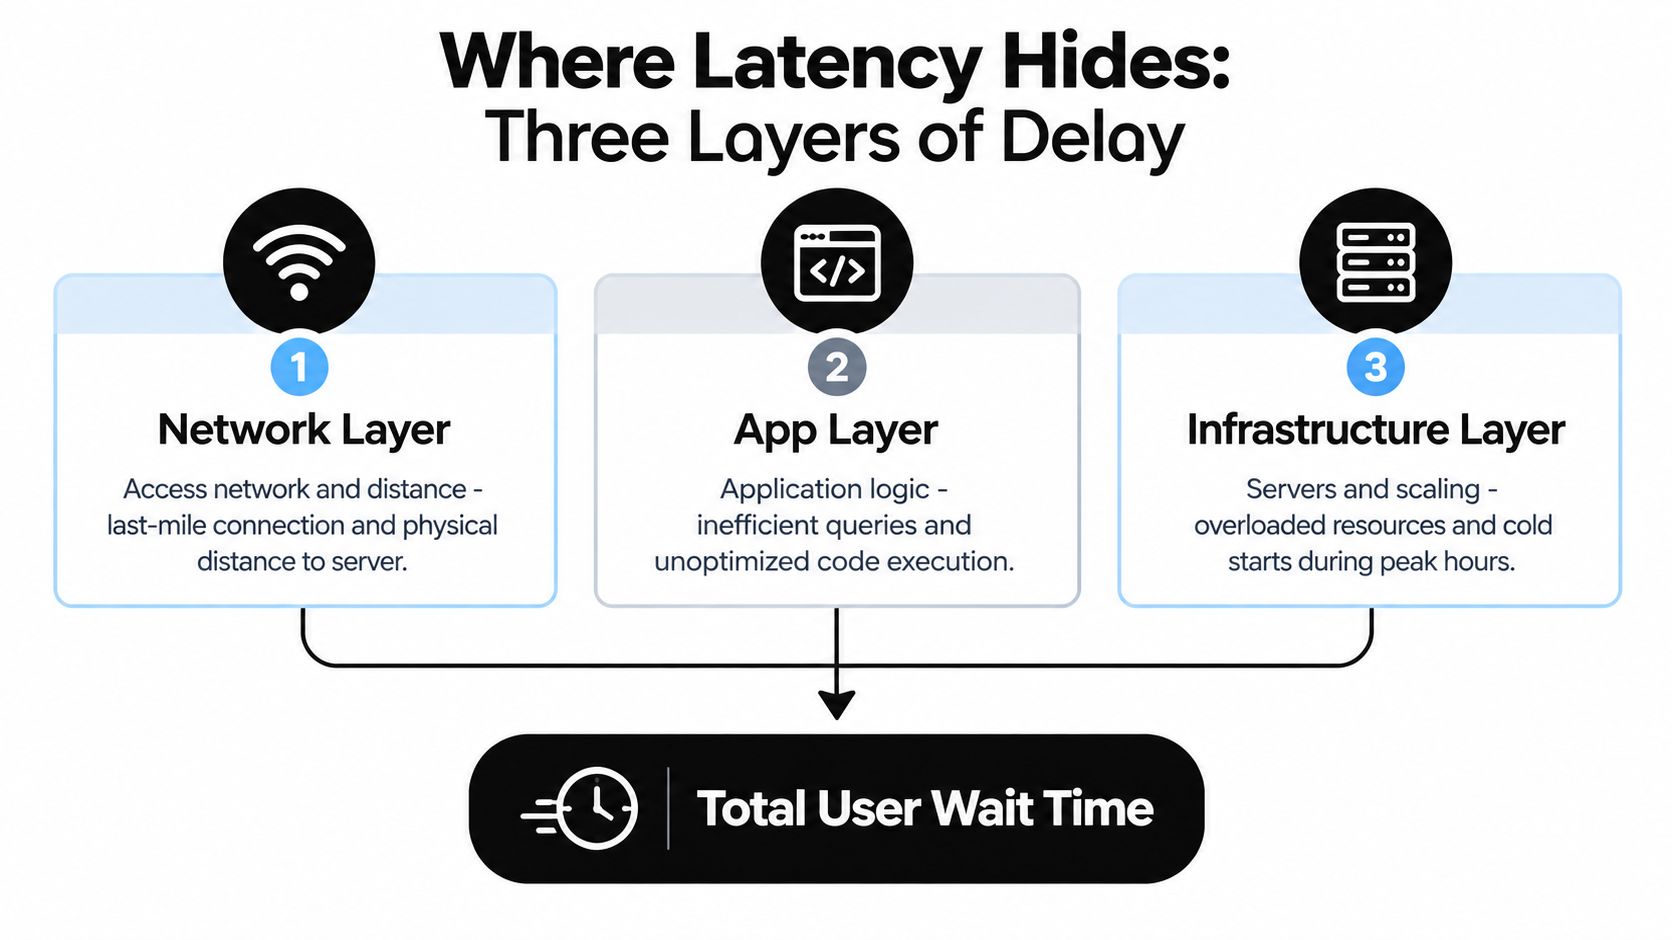
Network delay starts before your code runs
The first delay may happen long before your app touches a request. Home broadband, mobile congestion, overloaded buffers, and physical distance all shape response time.
An IETF-linked study on broadband latency under load reported that advanced queue management on a DOCSIS cable network produced an immediate 48% downstream latency reduction, and the same source reported 149 ms downstream and 356 ms upstream aggregate latency under load in 2020 measurements (Broadband America latency-under-load findings presented through the IETF). The same measurements reported 103 ms average downstream cable latency under load versus 194 ms for DSL, making cable about 47% lower on that measure in the study.
For shared apps, that means the same backend can feel very different to different households. If users connect from far-away regions, a quick way to reason about placement is to review available data centers worldwide and compare where your traffic originates versus where your critical services run.
App delay often comes from fan-out
A single page load may trigger calls to auth, billing, content metadata, permissions, recommendations, search, and analytics. The page can't finish until the important calls return. If one dependency stalls, the whole interaction inherits that delay.
This is why shared platforms get burned by "just one more API" thinking. Each added dependency increases the chance that one branch will be slow during peak demand.
Common app-layer causes include:
- Chatty APIs: The client asks for small pieces one by one instead of receiving a useful bundle.
- Unoptimized queries: A database returns the right answer, but only after scanning too much or joining too much.
- Render blocking: The browser waits on scripts or data before showing enough of the screen to reassure the user.
A practical starting point is stronger network usage monitoring, because request volume patterns often reveal whether latency follows usage bursts, geographic concentration, or one noisy feature path.
The user's wait is usually a chain, not a point problem. One weak link is enough.
Infrastructure delay shows up under pressure
Even well-designed code can slow down if the underlying resources aren't ready or are already busy. Cold starts, overloaded shared instances, distant storage, and bursty block I/O all create hidden pauses.
In cloud block storage, a 2026 systems paper reported that dual-bucket throttling reduced P99999 tail latency by up to 83% in burst scenarios (NSDI paper on burst-aware throttling for cloud block storage). That's an ultra-high-percentile result, but it matches what operators see in practice. Bursts don't hurt only average performance. They create the ugly outliers users remember.
How to Measure Latency That Actually Reflects User Experience
If you measure only averages, you'll congratulate yourself while users keep complaining.
That's because interactive systems rarely fail evenly. Most requests are fine. A few are slow. In shared platforms with fan-out, those slow ones dominate the experience because one page can wait on several backends at once.
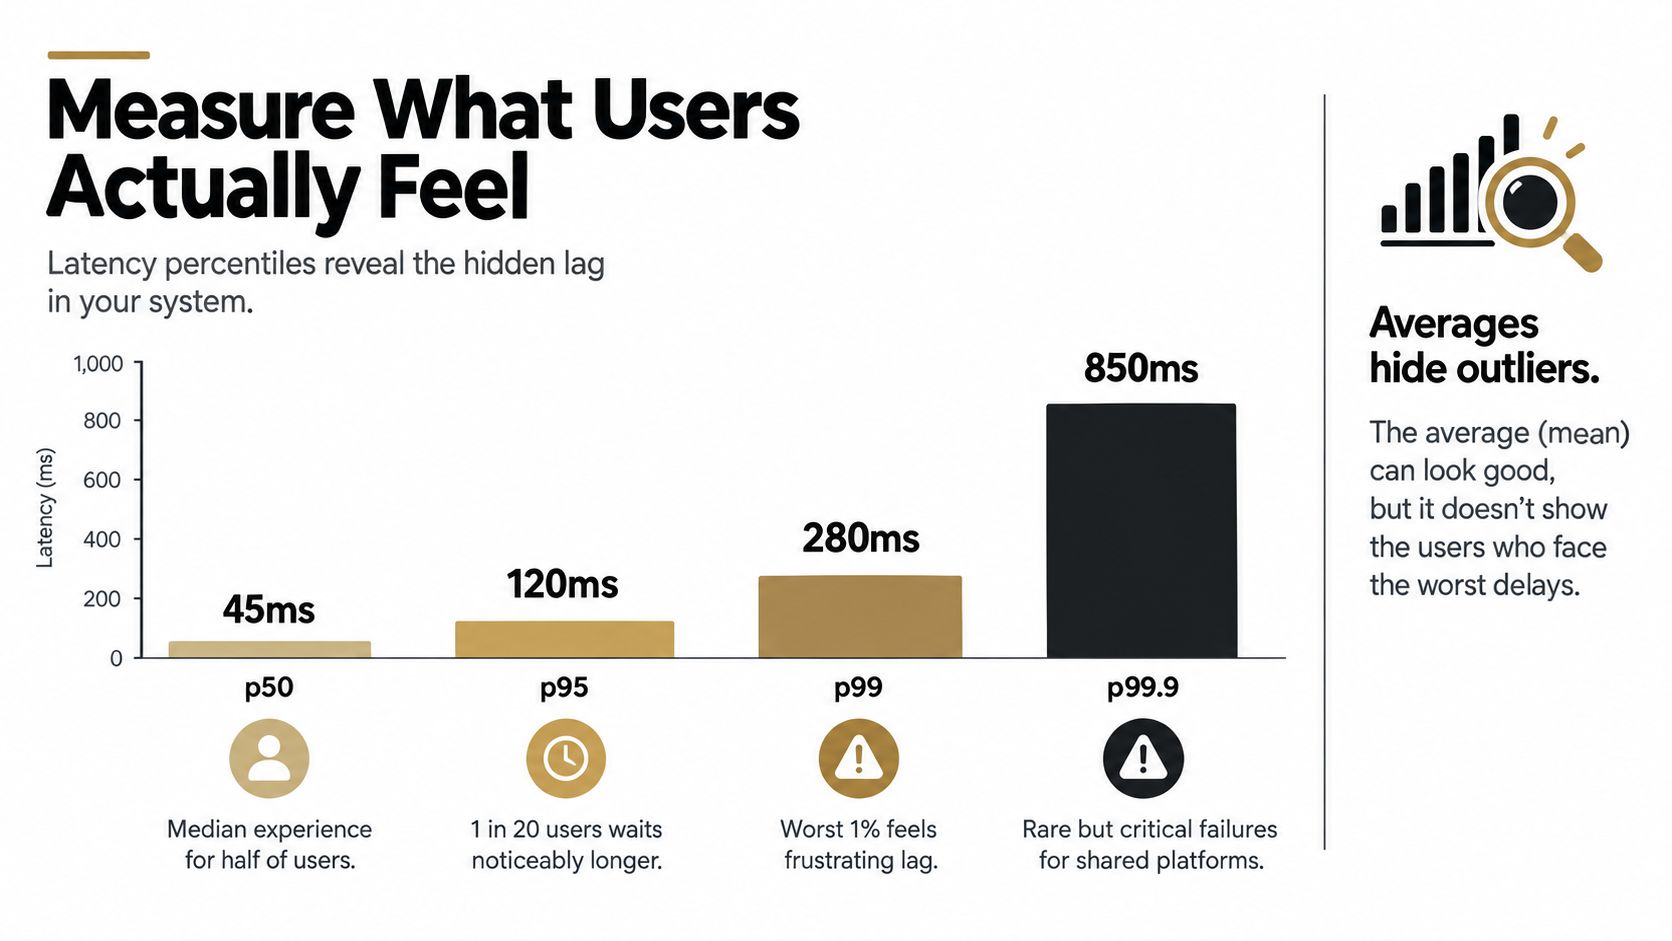
Start with percentiles, not just the mean
Percentiles answer a more useful question: how bad was the experience for the slowest slice of users?
- p50 shows the median experience.
- p95 shows the slower edge of normal.
- p99 shows the painful tail.
- Very high percentiles reveal rare stalls that can still matter a lot in shared environments.
Research on distributed service scheduling is especially clear here. It reports up to 81% improvement in 99th-percentile response time, with simultaneous gains of up to 54% in mean response time and 29% in throughput under high load (distributed scheduling research focused on tail latency). The broader lesson is simple: tail-latency fixes can improve both user experience and system efficiency.
Measure under load, not only in quiet conditions
A common mistake is testing a feature when the system is idle, then assuming those results represent production. They usually don't.
Use more than one lens:
- Browser timing: Measure time to visible content, interactivity, and important UI milestones.
- Synthetic checks: Run scripted probes from key regions at regular intervals.
- Real user monitoring: Capture what actual users experienced on real devices and connections.
- Backend tracing: Follow a request across services so fan-out and queueing are visible.
If your team needs a good framing for thresholds and ownership, a response time SLA guide can help turn raw measurements into clear service expectations.
Measurement rule: If a chart can't explain a user's complaint during peak hour, it isn't the right chart.
What to log when latency gets weird
The logs that help most aren't always the loudest ones. For shared apps, I usually want to see:
- Request path: Which downstream calls were involved.
- Queue timing: How long the request waited before execution.
- Cache outcome: Whether a fast path was available.
- Region and device context: So geography and client type don't stay hidden.
- Load state: What else the system was doing at the same moment.
One more point trips up teams new to percentile thinking. A p99 issue doesn't mean the whole app is broken. It means a small but important slice of interactions is much worse than the rest. On a shared platform, that slice often appears exactly when concurrency rises.
Proven Latency Optimization Techniques With Trade Offs
There isn't one best latency optimization technique. The right choice depends on where the delay lives and what kind of workload you're protecting.
Some fixes shorten travel distance. Others reduce queue buildup. Others cut the amount of work per request. The hard part isn't finding options. It's choosing the option that helps your workload without creating a different failure mode.
Choosing the Right Latency Optimization Technique
| Technique | Best For | Latency Impact | Trade Off to Consider |
|---|---|---|---|
| Edge caching and CDN placement | Static assets, manifests, repeat reads, globally distributed users | Reduces distance and offloads origin work | Cache invalidation gets harder, and dynamic personalized content may not benefit much |
| Smarter routing and queue management | Congested access paths and unstable peak-hour responsiveness | Stabilizes delay during load and reduces queueing pain | Requires network visibility and often coordination outside the app team |
| Connection reuse and modern protocols | Repeated small requests such as APIs, auth checks, and interactive sessions | Cuts handshake and setup overhead | Gains depend on client support, proxies, and existing architecture |
| API consolidation and query tuning | Chatty frontends and database-heavy pages | Shrinks fan-out and server work per interaction | Can increase payload size or require larger code changes |
| Burst-aware throttling | Shared infrastructure with spiky demand | Protects the tail by isolating bursts before queues explode | Some workloads may see stricter admission behavior during peaks |
| Hedged requests and tail-aware scheduling | Fan-out systems where one slow branch delays the full response | Reduces worst-case waits when stragglers dominate | Can increase duplicate work and must be used carefully |
A few techniques worth understanding deeply
Edge and proximity placement help when distance is a real part of the delay. That's especially useful for login pages, media manifests, and collaborative assets used across regions. The earlier edge-computing research showed that locality can improve latency, but it also showed that placement alone doesn't erase all delay. If the backend still performs several serial checks, users may only feel part of the gain.
Queue management is one of the most underrated tools. Teams love adding capacity because it feels straightforward. But if the path suffers from bloated buffers or poor request scheduling, more capacity doesn't always remove the line. Sometimes the best latency optimization is controlling who waits, where they wait, and for how long.
Tail-aware scheduling matters a lot for shared platforms. In distributed systems with fan-out, the last dependency to finish often defines the whole interaction. That's why techniques like hedged requests can help. You send a backup request only when a call looks like it's becoming a straggler. Used carefully, that can rescue the tail. Used carelessly, it can overload the system further.
AI and model-serving teams need one extra warning
Latency optimization in AI systems often comes with quality and hardware trade-offs. A 2026 Frontiers study notes that quantization and structured pruning can reduce latency by 10% to 40%, but those gains vary by architecture, hardware, and optimization method, and the authors explicitly note a lack of validation on automotive-grade, safety-compliant platforms (Frontiers review on latency, pruning, quantization, and edge AI constraints). In plain terms, a faster model isn't automatically an acceptable model.
That matters for collaborative AI tools and shared assistants. If lower latency comes from reducing output quality or reliability, users may notice the degradation before they appreciate the faster response.
A solid companion topic here is load balancing solutions, because many practical latency wins come from distributing contention more intelligently before requests pile up on one hot path.
Putting It All Together for AccountShare and Similar Platforms
On shared-subscription platforms, the most useful mindset is this: protect the interaction, not just the infrastructure.
A user opening a stream, launching a design workspace, or entering an AI tool doesn't care whether the delay came from the network edge, an overloaded auth service, or a bursty storage path. They care whether the app answered quickly when they needed it. That pushes teams toward a layered playbook instead of isolated tuning.
A practical order of operations
Start with the visible path. Identify the few interactions where delay hurts trust fastest. Login, launch, playback start, workspace open, and first useful response tend to matter more than background tasks.
Then work in this order:
- Remove obvious distance and repeat work. Cache what can be cached. Place latency-sensitive services closer to users where practical. Reuse connections and eliminate unnecessary round trips.
- Cut fan-out before adding complexity. If one screen calls too many dependencies, reduce that count. Bundle responses, simplify blocking paths, and avoid serial waits where parallelism is safe.
- Control queues during peaks. Separate interactive traffic from bulk or bursty traffic. If multiple classes of work compete for the same resource, the urgent work needs protection.
- Tune the tail deliberately. Once the broad path is cleaner, focus on stragglers. Tail-aware scheduling, burst-aware throttling, and careful retry strategy become valuable.
What teams often get wrong
Some teams jump directly to expensive architecture changes. Others stay stuck in micro-optimization. Both can miss the issue.
A few patterns usually produce better results:
- Coordinate across layers: Network, app, and infrastructure teams should inspect the same user journey, not separate dashboards in isolation.
- Validate with peak-hour traffic: Quiet-hour wins can disappear when concurrency rises.
- Protect interactive requests first: Shared platforms often carry mixed workloads. Background sync, analytics, and batch jobs shouldn't delay a user's immediate action.
Shared platforms benefit most when they isolate burst traffic early and keep interactive paths short.
How to confirm you're improving the right thing
After each change, compare the before and after for the user journey that motivated the work. Did the frustrating tail shrink? Did the worst periods become calmer? Did one fix move delay to another dependency?
The most durable latency optimization programs are iterative. One change improves locality. The next reduces fan-out. The next protects the tail under contention. Taken together, they make a shared app feel dependable instead of merely fast in ideal conditions.
Your Next Steps to Faster More Reliable Experiences
Latency optimization works best when teams stop treating delay as one number. Users feel a chain of waits across the network, application, and infrastructure. On shared platforms, they feel the tail most of all.
Keep the checklist simple:
- Pick one user journey that matters during peak demand.
- Measure percentiles, not just averages so the painful tail is visible.
- Trace fan-out to find the dependency that holds up the whole response.
- Check queueing under load instead of testing only in calm conditions.
- Apply one fix at a time so you can tell what changed.
- Re-test with real usage patterns to confirm the gain survives contention.
The biggest shift is mental. Faster servers alone won't solve every delay. Better placement, better queue control, fewer blocking dependencies, and smarter tail handling usually matter more.
If your team keeps that model in view, latency optimization stops being a vague performance project and becomes a practical way to make shared digital experiences feel reliable when demand is highest.
AccountShare helps people access premium subscriptions for streaming, AI tools, and software through secure group purchasing, with a strong focus on availability during peak demand and faster response times. If you're thinking seriously about how shared platforms stay responsive when many users arrive at once, visit AccountShare to see how the model works in practice.